Take rate is the percentage of each transaction value a platform keeps as revenue. The formula is revenue retained divided by total payment volume or GMV, so keeping $50 from $1,000 produces a 5% take rate.
You're in a pitch meeting, and a slide flashes “Take rate: 8%.” The number sounds useful, but you're not sure what it describes. Is it revenue, profit, a seller commission, or a marketing figure?
The answer matters because take rate connects transaction volume to platform revenue. It can help you price a marketplace, compare payment rails, assess monetization, and explain monthly results to investors. But the headline number can also hide important revenue lines and costs. A founder who tracks only the commission percentage may misunderstand the economics of the entire transaction.
Table of Contents
The Plain-English Definition of Take Rate
Take rate is the share of transaction value that a marketplace or payments provider retains as revenue. In a marketplace, the transaction value is usually gross merchandise value, or GMV. In a payments business, the comparable denominator is often total payment volume, or TPV. The core definition and calculation are outlined in this take rate explanation.
The formula is simple:
Take rate = revenue retained ÷ GMV or total payment volume
Suppose a customer buys a product for $100. If the platform retains $8 in commission revenue, its gross take rate is 8%. If it retains $25, the gross take rate is 25%. The customer's purchase price is the same, but the platform's monetization per transaction is different.
That distinction separates take rate from profit. A platform may keep $8 from a $100 transaction, then spend part of that amount on payment processing, fraud screening, refunds, customer service, support, or fulfillment. Take rate measures the revenue retained before those operating costs are deducted. It isn't a margin measure.
GMV and total payment volume
GMV describes the value of goods or services sold through a marketplace. If sellers complete $1,000 in orders, the marketplace has $1,000 of GMV, even if it keeps only a portion as commissions.
Total payment volume describes the value of payments processed by a payments provider. A provider can process payment volume without owning the customer relationship, setting the product price, or operating a seller marketplace. The denominator therefore reflects the business model being measured.
A marketplace founder usually asks, “How much revenue do we retain from the value sold through the platform?” A payments founder asks, “How much fee revenue do we earn from the value moving through our payment system?” Both questions use take rate, but the underlying transaction flow differs.
Practical rule: Never compare two take rates until you know whether each company uses GMV, total payment volume, or another transaction denominator.
The first number founders usually see is the gross take rate, often based on commissions or processing fees. The more useful management view may be the effective or net take rate, which can include other transaction-linked revenue lines. Those versions can behave very differently, especially when a platform monetizes advertising, foreign exchange, logistics, or subscriptions alongside the original commission.
How to Calculate Take Rate the Right Way
Start with one transaction ledger and make the numerator explicit. Suppose a marketplace processes $1,000,000 in GMV and records $80,000 in seller commissions. The gross take rate is:
$80,000 ÷ $1,000,000 = 8%
That calculation answers a narrow question: how much revenue came from seller commissions compared with the value of goods sold? It doesn't yet capture every fee connected to the transaction.
A reusable calculation
Assume the same marketplace also records a $5,000 payments fee rebate, $7,500 in FX margin, and $15,000 in advertising revenue during the period. Treating each item as transaction-linked revenue produces this reconciliation:
| Revenue line | Amount | Calculation against GMV |
|---|---|---|
| Seller commissions | $80,000 | $80,000 ÷ $1,000,000 = 8% |
| Payments fee rebate | $5,000 | $5,000 ÷ $1,000,000 = 0.5% |
| FX margin | $7,500 | $7,500 ÷ $1,000,000 = 0.75% |
| Advertising revenue | $15,000 | $15,000 ÷ $1,000,000 = 1.5% |
| Transaction-linked revenue | $107,500 | $107,500 ÷ $1,000,000 = 10.75% |
The resulting effective take rate is 10.75%. The commission-only figure is 8%, while the broader figure includes the additional revenue lines that finance can reasonably attribute to the same transaction flow.
The math works because revenue scales with transaction volume. A take rate explanation from eInvesting for Beginners describes this relationship and contrasts marketplace economics with payments economics. A small change in rate can affect revenue materially when volume is large, but the effect still depends on whether the added revenue creates corresponding costs.
Avoid numerator errors
The most common reporting mistake is mixing different fee populations. A team might include buyer fees, seller commissions, payment rebates, and advertising revenue in the numerator, while using only seller GMV as the denominator. That can make the reported rate look stronger than the underlying economics.
Choose a policy before reporting the metric:
- Define the denominator. Use GMV for marketplace sales or total payment volume for payment processing.
- Tag the numerator. Separate commissions, payment revenue, FX margin, advertising, logistics, subscriptions, refunds, and rebates.
- State the version. Label the result gross take rate, effective take rate, or another clearly defined measure.
- Reconcile the total. Tie every included line to the general ledger and settlement reports.
A clean dashboard can show both gross and effective take rate. Investors can then see whether monetization comes from the core commission or from supporting products.
Take Rate Benchmarks Across Marketplaces and Payments
A founder sees 5% on a payments slide and 20% on a marketplace slide. Neither figure is automatically better. The rate reflects what the platform does, which transaction value it uses, and which revenue lines it counts. An explainer from eInvesting for Beginners describes marketplace rates commonly ranging from 10% to 30%, with commission-based marketplace fees extending from 0% to 50% or more by industry and geography. It also cites a 2021 credit-card processing benchmark of 1.3% to 3.5%.
| Platform category | Published take rate range | Primary revenue drivers |
|---|---|---|
| Online marketplaces | 10% to 30% commonly described | Seller commissions, buyer fees, ads, subscriptions |
| Commission-based marketplaces | 0% to 50% or more | Industry-specific commissions and service fees |
| Credit-card processing | 1.3% to 3.5% in a 2021 benchmark | Processing and network-related fees |
| Web3 platform | Compare against the applicable flow | Processing, conversion, protocol, and service fees |
The ranges answer different economic questions. A marketplace may provide discovery, trust, dispute handling, seller tools, and fulfillment, so its headline commission can be higher. A payment provider may authorize, route, and settle funds, earning a smaller fee per payment while processing substantial volume. Before choosing a target for this quarter, identify which operating work your product performs and which costs it carries.
Web3 founders need comparisons with matching denominators. A token exchange, custodial wallet, stablecoin payment gateway, and prediction-market interface may all call revenue a take rate, yet count different transaction flows and fees. For event-based trading, understanding prediction market fees helps separate displayed charges from the platform's broader monetization.
Denominator before benchmark
Document these choices before setting a target:
- Transaction type: goods, services, card payments, bank transfers, token swaps, or stablecoin settlement.
- Revenue scope: commission alone, or commission plus payment, FX, advertising, and logistics revenue.
- Cost scope: gross revenue before costs, or contribution revenue after transaction-specific expenses.
- Customer side: buyer fees, seller fees, or both.
Bank transfers add their own processing and settlement costs. Teams comparing payment rails should review ACH payment processing within the broader settlement model instead of treating every payment method as economically identical.
Digital goods and crypto flows may sit toward the lower end of marketplace-style ranges because delivery can be automated and physical fulfillment may be absent. A lower headline rate still needs a margin check. Customer acquisition, custody, compliance, liquidity, fraud controls, and conversion costs can absorb the difference. For month-end reporting, reconcile each included revenue line to the relevant flow, then compare the resulting effective rate with the published range rather than comparing commission percentages alone.
Effective Take Rate and the Hidden Revenue Lines
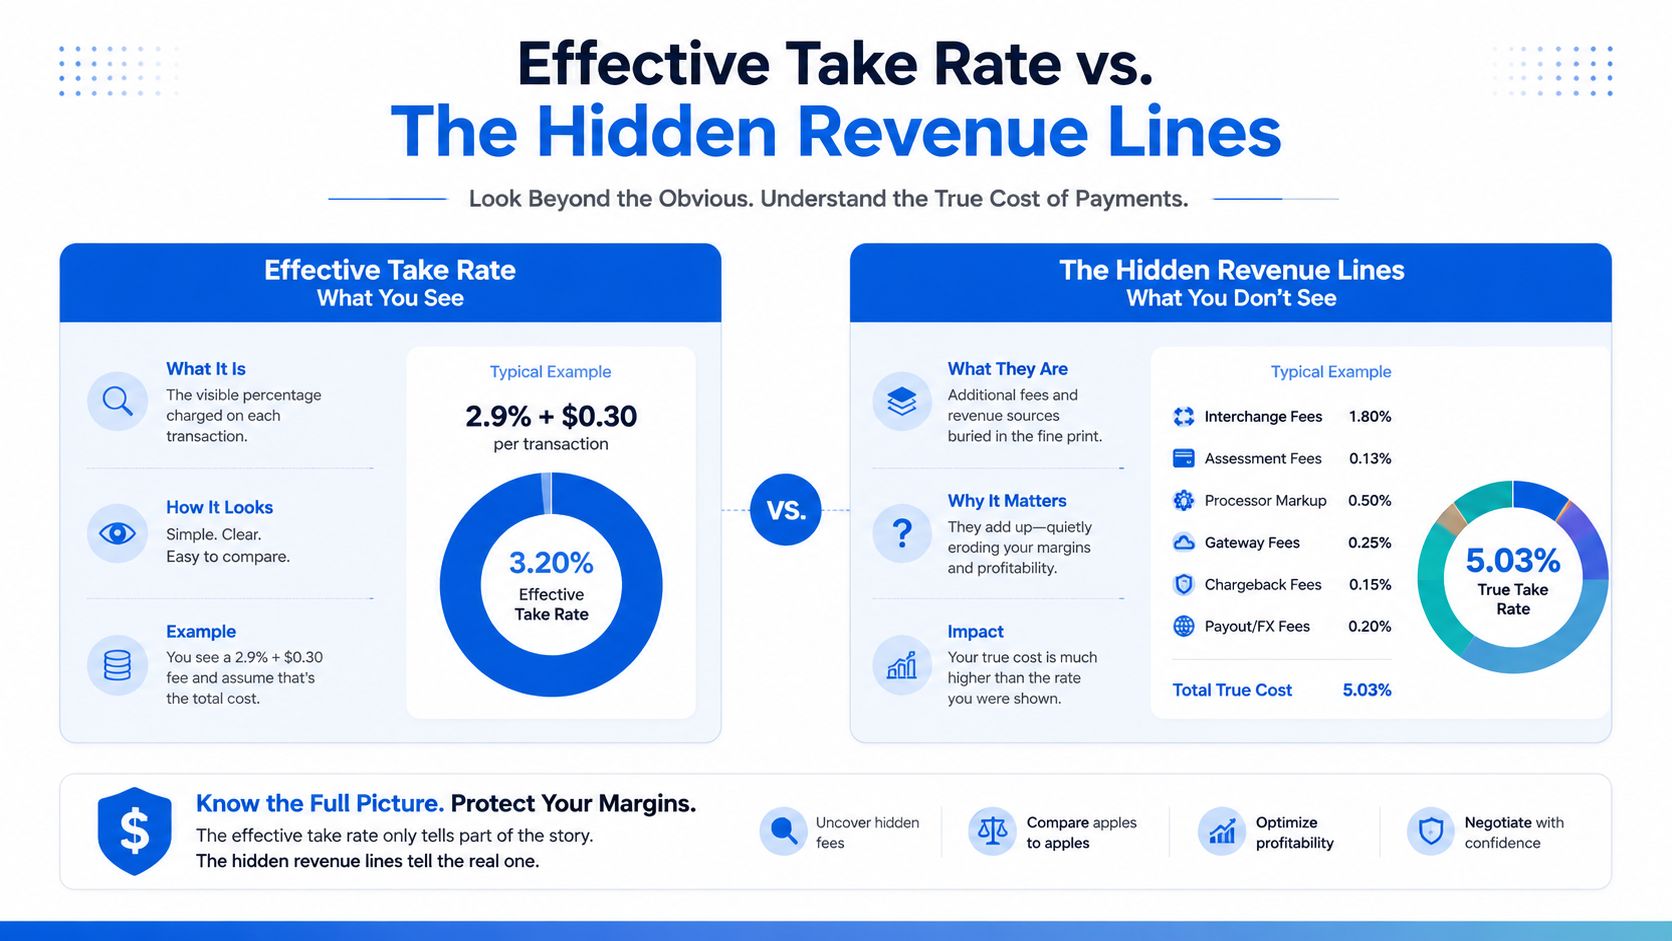
A headline commission answers only one question. Effective take rate asks how much of the transaction value the platform monetizes across all connected revenue lines. That can include commissions, payment margin, foreign-exchange spread, promoted listings, subscriptions, fulfillment surcharges, instant-payout fees, and other transaction-linked charges.
A marketplace advertising a 12% commission may also earn revenue from promoted placement, payment conversion, delivery, and faster settlement. If those lines together add another 12% of GMV, the platform's effective take rate reaches 24%, even though the seller sees a 12% commission headline. The calculation is conceptually simple, but the accounting mapping requires discipline.
Build the reconciliation around GMV
Finance teams can create an effective-rate bridge with one row for each revenue source:
| Revenue line | Question to answer |
|---|---|
| Seller commission | What amount was charged directly on the sale? |
| Payment margin | Did the platform retain part of payment pricing or rebates? |
| FX margin | Was currency conversion connected to the transaction? |
| Advertising | Did the seller pay for placement or promotion? |
| Subscription allocation | Can part of a subscription be attributed to transaction activity? |
| Logistics | Did the platform retain a delivery or fulfillment margin? |
| Instant payout | Did the seller pay for accelerated settlement? |
Divide each included line by the same GMV or payment-volume denominator. Don't switch denominators halfway through the bridge. A subscription may require an allocation policy, while an advertising line may require a rule that distinguishes transaction-linked campaigns from broader brand spend.
Web3 requires an extra layer
Web3 platforms face additional complexity. Gas rebates, bridge fees, token incentives, liquidity arrangements, and conversion spreads can make the apparent platform share difficult to interpret. Some items are revenue, some are contra-revenue, and some are costs or incentives. Finance should classify them based on the company's accounting policy rather than automatically adding every wallet movement to take-rate revenue.
The useful question is not, “What commission do we advertise?” It's, “What value connected to each transaction reaches our income statement, and what costs are required to earn it?” That answer gives founders a rate they can compare internally across seller cohorts, payment rails, and product packages.
Real-World Examples From Web3 and Traditional Platforms
Consider a marketplace that begins with a straightforward seller commission. Its first dashboard shows a 14% blended take rate, reflecting the mix of sellers and categories active at launch. Later, the team adds paid placements and a premium seller tier. As seller mix changes, the blended rate rises to 19%.
The important lesson isn't just that the rate increased. The operating lever was advertising inventory and premium access, not necessarily a higher base commission. Sellers who buy visibility or advanced tools contribute more revenue per dollar of GMV. Meanwhile, a shift toward categories with stronger adoption of those add-ons can change the blended result even if the standard commission schedule stays unchanged.
A crypto payments platform presents a different pattern. It routes merchant volume through USDC on a low-fee layer, earns a 0.3% processor margin, and retains a 0.8% protocol fee. Together, those lines produce an effective take rate near 1.1% before considering other costs.
The operational levers here are rail selection, liquidity management, and FX hedging. The platform may earn less per transaction than a traditional marketplace, but it can also avoid some physical fulfillment and automate settlement. The rate must therefore be evaluated against compliance, custody, liquidity, support, and conversion costs.
| Revenue line | Traditional marketplace | Web3 payments platform |
|---|---|---|
| Core platform fee | Seller commission | Protocol or service fee |
| Payment revenue | Processing margin or payment-related revenue | Processor margin |
| Conversion revenue | FX spread on cross-border sales | Crypto-to-fiat or fiat-to-crypto margin |
| Additional monetization | Ads, premium seller tools, logistics | Treasury, settlement, or integration services |
| Main operational lever | Seller mix and advertising adoption | Payment rail, liquidity, and FX management |
Founders building cross-border payment operations can use banking for web3 as background when considering how fiat accounts, crypto flows, and treasury processes interact. The key comparison is structural. A marketplace's rate may reflect a broad commerce stack, while a web3 payment flow may monetize a narrower movement of funds.
Neither rate is automatically better. A high rate can accompany high service costs, and a low rate can support an efficient product if the cost base is controlled. Your quarterly decision should focus on which revenue line moved, which customers generated it, and whether contribution economics improved with it.
How Companies Can Measure and Optimize Their Take Rate
A founder reviewing a OneSafe customer's monthly reconciliation sees $50 million of volume, but the headline commission explains only part of the revenue. Before treating take rate as a KPI, make each transaction record reliable: GMV or payment volume, customer and seller, payment method, currency, fee type, refunds, chargebacks, and settlement date.
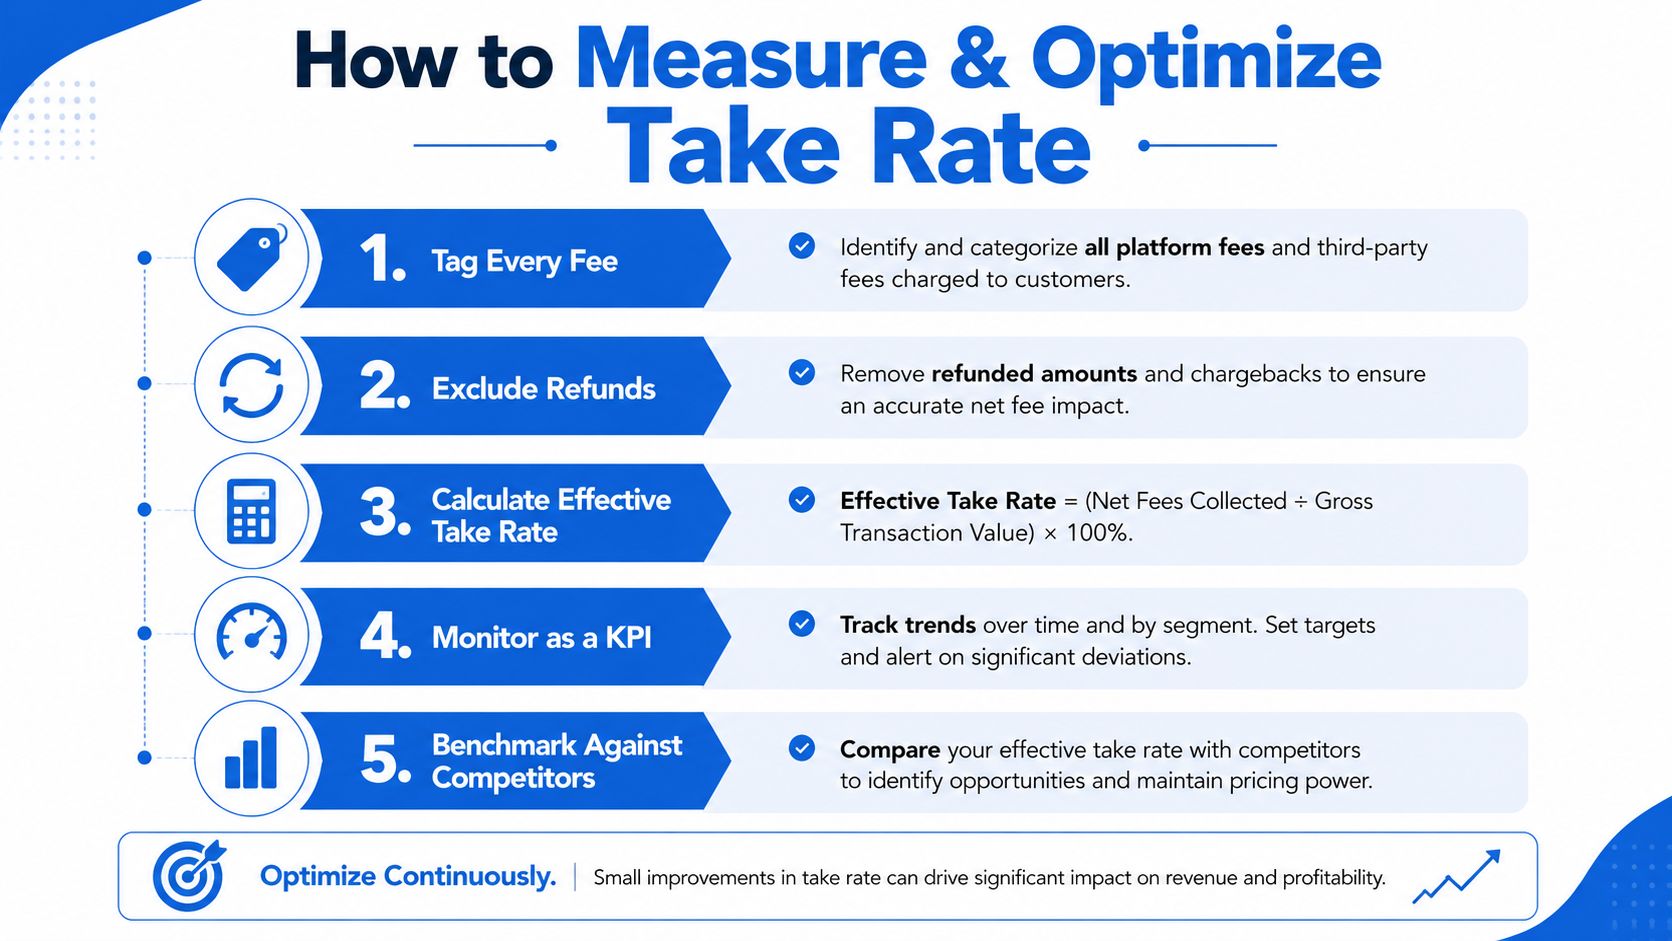
Use this measurement routine:
- Tag every fee at transaction level. Separate commissions, payment margin, FX revenue, ads, logistics, subscriptions, and payout charges.
- Remove reversals from the denominator. Exclude refunds and chargebacks under the policy used in financial reporting.
- Calculate both views. Gross take rate uses commission revenue. Effective take rate includes approved transaction-linked revenue from commissions, payments, FX, advertising, logistics, and other recorded lines.
- Reconcile monthly settlements. Match platform records with bank, processor, wallet, and ledger activity.
- Segment the result. Compare seller cohorts, currencies, countries, payment rails, and product tiers.
The accompanying checklist gives teams a visual operating reference.
Choose the lever before changing the fee
Processor renegotiation can improve contribution economics without changing the customer-facing fee. Batching stablecoin payouts may reduce operating friction. Tiered seller commissions can align pricing with volume or service intensity, while tighter FX controls can reduce the gap between quoted and settled rates.
A dashboard should connect each change with its effect on volume and effective take rate. The business performance metrics dashboard resource provides context for recurring KPI reviews, while your own transaction and accounting policy must define the measure.
For a OneSafe customer moving $50 million of monthly volume through USDC rails, a 15-basis-point increase in FX margin produces:
$50,000,000 × 0.0015 × 12 = $900,000
15 basis points equals 0.15%. That equals $75,000 per month, or $900,000 annualized. Verify the units before presenting an optimization estimate to the board. The quarterly decision is whether the margin improvement came from pricing, better FX execution, or a shift in customer and payment-rail mix, and whether the resulting effective take rate improved without weakening conversion.
Take Rate, Margin, and Regulatory Reporting
Take rate becomes misleading when founders read it without the costs required to generate each dollar of revenue. A 15% headline commission may look attractive, but payment processing, refunds, chargebacks, fraud controls, customer support, and fulfillment can reduce the contribution left per transaction. Platform economics guidance distinguishes take rate from profit margin and recommends reading it alongside gross margin and contribution margin.
Gross margin asks what remains after direct costs associated with revenue. Contribution margin goes further by examining the economic contribution after transaction-level and variable operating costs. Take rate sits earlier in the chain. It tells you how much revenue the platform retains, not how much cash the business ultimately keeps.
Web3 founders also need a reporting process that connects digital-asset activity with recognized financial records. Stablecoin settlement doesn't remove the need to understand applicable money-services-business obligations, FinCEN requirements, tax treatment, or jurisdiction-specific rules. Requirements depend on the company's activities, locations, counterparties, and legal structure, so founders should obtain advice from qualified legal and accounting professionals rather than assume that a payment rail determines the answer.
Monthly reporting artifacts
| Metric | What it measures | Common pitfall | Monthly artifact |
|---|---|---|---|
| Take rate | Revenue retained against GMV or payment volume | Treating it as profit | Take-rate versus GMV log |
| Gross margin | Revenue remaining after direct costs | Omitting payment or fulfillment costs | Gross-margin reconciliation |
| Contribution margin | Transaction-level economic contribution | Blending fixed overhead into every order | Cohort or rail contribution report |
| Reporting accuracy | Whether ledger values match settlements | Ignoring token valuation at settlement | On-chain to fiat reconciliation |
| Fee compliance | Whether charges follow approved schedules | Applying one schedule across jurisdictions | Jurisdiction-by-jurisdiction fee register |
Maintain a monthly take-rate versus GMV log, a jurisdiction-specific fee schedule, and reconciliation reports that tie on-chain revenue to fiat-recognized income. Accrual timing can complicate the month-end view, so finance teams may also benefit from reviewing accounting entries for accruals.
The operating rule is straightforward: track take rate, contribution margin, and reporting accuracy every month. If the rate rises while contribution falls, investigate costs. If contribution rises while reporting cannot reconcile, fix the data before optimizing pricing.
OneSafe provides multi-currency business accounts, global payment workflows, corporate cards, and crypto-compatible USDC deposits and withdrawals through a single interface. Visit OneSafe to review whether its fiat and web3 payment infrastructure fits your take-rate measurement and settlement workflow.